The ASC incurred an operating loss of $4.2 million in 2014–15. The key factors contributing to this loss were:
- an unfunded depreciation expense as a result of revaluations to land, buildings, property, plants and equipment since 2010.
- timing differences between recognition of expenses incurred in 2014–15 and associated revenue from external parties received in prior years.
- increased high performance research grants being paid out in the year due to a carry-over of funding not spent in 2013-14.
Table 18 compares the 2014–15 results to 2013-14 and to Original Budget estimates.
Key results against 2013-14 are primarily within revenue and grants. The increase in revenue across years is primarily driven by an agreement with the Department of Health to deliver participation and high performance outcomes. The increase in grant expenses was due to higher high performance and participation grants paid out from this additional funding.
The overall ASC performance against the Original Budget position is detailed in Note 19 of the financial statements.
| Actual 2014–15 $m |
Actual 2013–14 $m |
Variance $m |
Actual 2014–15 $m |
Original Budget 2014–15 $m |
Variance $m |
|
|---|---|---|---|---|---|---|
|
Income |
311.4 |
297.8 |
13.6 |
311.4 |
296.1 |
15.3 |
|
Expenses |
315.6 |
307.1 |
8.5 |
315.6 |
303.7 |
11.9 |
|
Surplus/(Deficit) |
-4.2 |
-9.3 |
5.1 |
-4.2 |
-7.6 |
3.4 |
Note: Budget figures are based on the 2014-15 Portfolio Budget Statements.
Financial position
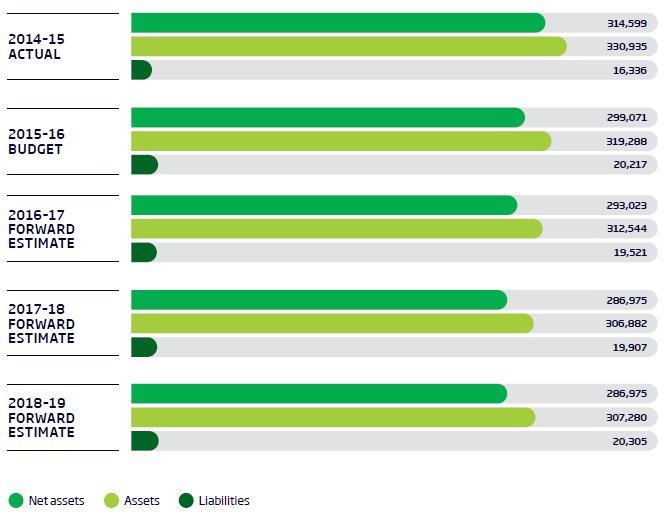
Key indicators of the health of the ASC’s financial position are demonstrated by its ability to sustain its asset base, pay debts as they fall due in the short term and maintain prudent levels of long-term liabilities. The ability of the ASC to sustain its asset base is indicated by changes in net assets. Chart 2 shows that net assets are stable in relation to 2013–14 and forward estimates.
Chart 2: Net asset position — actual results and budgeted financial year estimates
Note: Budget and forward estimates are based on the figures published in the 2013-14 PBS
| 2014-15 Actual | 2015-16 Budget | 2016-17 Forward Estimate | 2017-18 Forward Estimate | 2018-19 Forward Estimate | |
|---|---|---|---|---|---|
|
Net Assets |
314,599 |
299,071 |
293,023 |
286,975 |
286,975 |
|
Assets |
330,935 |
319,288 |
312,544 |
306,882 |
307,280 |
|
Liabilities |
16,336 |
20,217 |
19,521 |
19,907 |
20,305 |
Asset management
While the financial position of the ASC is considered to be sound, the Commission is reviewing its ongoing capital funding for the refurbishment and replacement of buildings and infrastructure, plant and equipment, to ensure the requirements and strategic direction of the ASC into the forward years.
